The Horse Racing Money Problem: Who Gets Paid?
Nine hundred and ninety-six million dollars.
That's what Australian racing paid out to horses in the 2024-25 season. Across 18,939 races, 28,601 individual horses had at least one start.
One thousand six hundred and seventy-seven of them collected half the money.
That is 5.9% of the horses that went to the races. The other 94.1% divided the remaining half between them, which is a polite way of saying that most of them divided very little.
I pulled every result of the season (every race, every runner, every dollar actually paid to a placing) and added it up per horse. This is what came out.
The curve
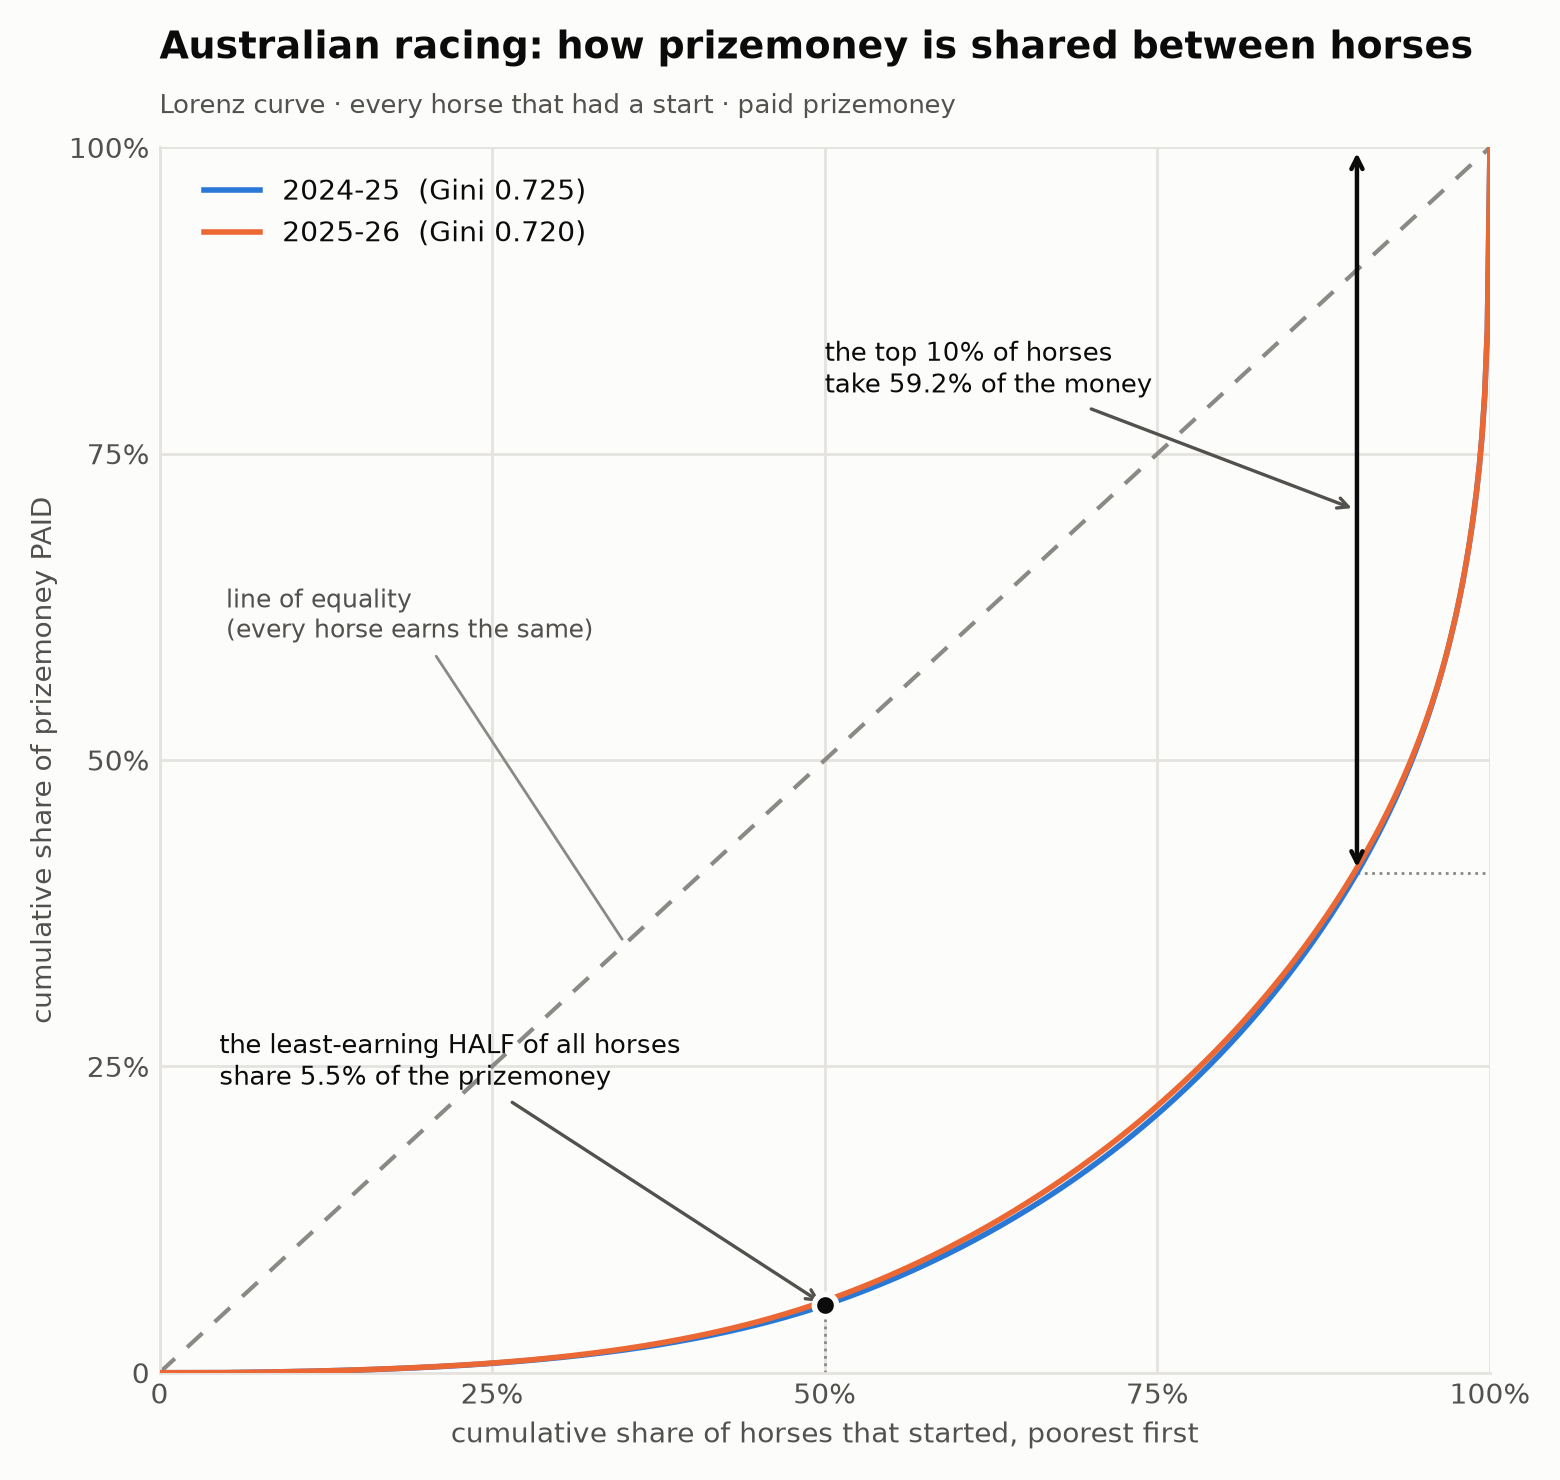
A Lorenz curve is the simplest picture of inequality there is: line everyone up from poorest to richest along the bottom, and plot what share of the total money they have between them as you go. Perfect equality is the diagonal. The further the curve sags below it, the more the top is taking.
Australian racing's curve sags a long way.
The numbers
The top 10% of horses took 59.2% of all prizemoney paid. The bottom 50% took 5.5%. Nearly half of all horses that started (45.8%) earned under $10,000 for the entire season. Another 4.2% earned nothing at all.
The Gini coefficient for the 2024-25 season is 0.725.
If you haven't come across a Gini coefficient before, it's a single number that summarises how unequal a distribution is. It runs from 0 (every participant gets exactly the same) to 1 (one participant gets everything). It's the standard measure economists use to compare inequality across countries, industries, or in this case, horse populations. The closer to 1, the more concentrated the money is at the top.
So what does 0.725 look like in context? Income inequality in developed economies generally lands somewhere in the 0.3 to 0.4 range. Australia sits at about 0.34. You have to move from income to wealth (who owns what, rather than who earns what) before you routinely see figures in the 0.7s. Australian racing distributes its prizemoney like a wealth distribution, not an income one.
And it does that among participants whose costs are broadly the same. The feed bill, the farrier, the float and the vet do not ask what class the horse is in. That's the part worth sitting with: wealth-grade inequality of reward, spread across a population paying roughly flat costs.
The chart above also shows the 2025-26 season (Gini 0.720). The curve barely moved. This is not a one-year anomaly. It is the shape of the sport.
Why every "average" you have read is wrong
The mean horse earned $34,841 last season. The median horse earned $12,675.
The mean is 2.7 times the median, and the reason is the shape above: a mean taken over a power law is dragged upwards by a handful of animals at the top. Via Sistina alone earned more than ten million dollars. She is in that $34,841 average, and so is every horse that ran six times for $4,000.
This matters more than it sounds, because the industry runs on averages. Average earnings per runner. Average return per start. Average prizemoney per horse in a syndication prospectus. Every one of those figures describes a horse that does not exist, and it overstates the typical animal by a factor of about 2.7. When someone quotes you an average in this sport, the honest translation is "some horses at the top earned a great deal, and I have spread their money evenly across all the others for presentational purposes."
The median is the number that describes the horse you are actually likely to own. It is $12,675. It is almost never the number you get shown.
None of this is a scandal. A sport that concentrates its rewards at the top is not doing anything underhanded. It is doing exactly what it was designed to do, and the same shape turns up in music, publishing and professional golf. But the design has consequences for anyone deciding whether to be in it, and those consequences are measurable rather than philosophical.
Which is what I want to measure next.
Next: at what class does the median horse stop paying for its own keep? The answer survived every cost assumption I threw at it.
Notes
Season 2024-25 (1 August 2024 to 31 July 2025), Australian races only, all eight states and territories. 2025-26 season (1 August 2025 to 31 July 2026) shown for comparison.
Prizemoney is PAID, not advertised: the money that actually landed on a runner, rather than the stake a race was published at. The two differ by about 2%, mostly unfilled placings in short fields plus trophies and bonuses that never reach a horse. Concentration figures only mean something on money that was genuinely collected.
Restricted to races that reached paying status; abandoned and nomination-stage races are excluded. Horses that started but earned nothing are included. Dropping them would delete the bottom of the distribution and flatter the result considerably.
Season aggregates reconciled against Racing Australia's published 2024/25 figures: race count within 0.2%, average field size within 0.2%.
Slot-funded races (The Everest chief among them, at $20 million) are funded by slot-holders buying in rather than by the usual club and principal-racing-authority distributions. They sit in these totals because the money reached the horses, but they are a distinct funding class and a meaningful share of the very top of the curve.